The seafloor is the missing variable in how beaches absorb wave energy
September 7, 2026 · By John Ian Lau
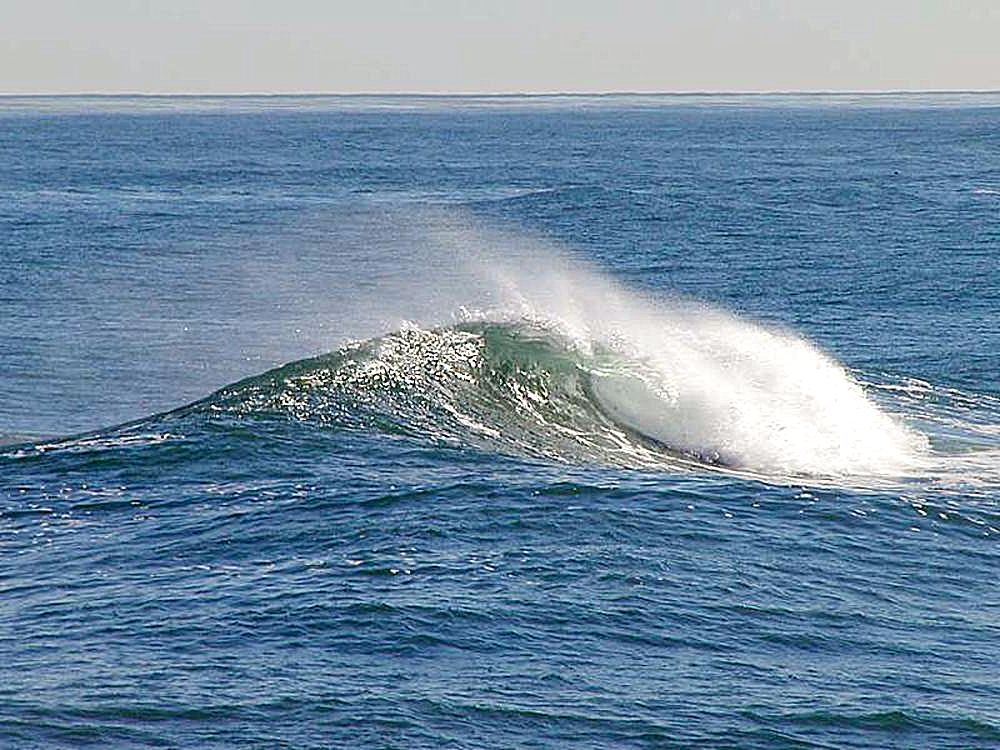
For decades, coastal forecasts have treated the wave arriving offshore as the main event. A fresh study from Scripps Institution of Oceanography at UC San Diego makes a quieter variable harder to ignore: the shape of the seafloor beneath the final stretch of a wave’s journey.
The research, led by Scripps PhD student Kanoa Pick and oceanographer Falk Feddersen, moves beyond the familiar split between spilling breakers and plunging breakers. Using a two-dimensional, fully nonlinear model, the team tested how offshore wave height interacts with the slope of the bottom as waves shoal, steepen and overturn near shore. The work was published in the Journal of Fluid Mechanics.
The result is a more precise picture of a process that surfers read instinctively. Steeper slopes generated larger, more horizontal overturns with thicker jets projecting from the crest. Gentler slopes produced smaller, more inclined overturns with thinner jets. The researchers also linked the geometry of those jets to the potential energy released when they hit the surface, creating turbulence and bubbles that help suspend and transport sand through the surf zone.
“Surfers are incredibly observant,” said Pick, the study’s lead author, in the UC San Diego account of the research. “They learn to recognize how changes in the swell and seafloor affect a wave, even if they don’t express those relationships through equations. Science gives us a way to test that intuition and quantify the physics behind it.”
That quantification matters because a beach is not a passive line on a map. Sand is a moving buffer, habitat and public asset. When breaking waves stir sediment, currents can shift it alongshore or offshore; the balance helps decide whether a beach holds its width, builds a bar or retreats. A model that can connect incoming wave conditions to the turbulence generated at the break gives planners a better way to distinguish a temporary reshuffle from a longer-term loss of natural protection.
NOAA defines bathymetry as the study of the depths and shapes of underwater terrain, a foundation for hydrography that also incorporates shorelines, tides, currents and waves. That makes the Scripps finding a practical data story: a wave forecast without a sufficiently detailed map of the bottom can miss the local physics that determines where energy is dissipated and where sand begins to move.
NOAA’s coastal work shows why the distinction extends beyond surfing. The agency’s Wave Exposure Model uses wave theory, wind generation and local water depth to estimate wave energy and seafloor sediment movement for shoreline and habitat decisions. In a separate NOAA National Ocean Service podcast, senior scientist Gregory Dusek described another reminder that local context changes the risk: “They’re just what they sound like: meteorologically-driven tsunami waves.” His point was about meteotsunamis, but the operational lesson is shared by coastal models—different forcing and different bottom shapes can produce very different outcomes at the water’s edge.
For coastal communities, the next step is not to replace forecasts with bathymetry. It is to join them. High-resolution seafloor maps, wave observations and sediment records can help identify beaches where a modest change in swell, storm direction or sea level will push the surf zone into a new regime. That intelligence can guide living-shoreline design, beach nourishment and habitat protection before emergency works become the default.
OceanVines exists to illuminate the inner sparks of every life we touch through our efforts in ocean conservation and education. Learning how the seabed turns moving water into shelter, erosion or habitat is part of that mission: the better we read the ocean, the more intelligently we can care for the communities that live beside it. Together, we celebrate The Greatest Good